ITINSIGHT
It is a friendly infrastructure monitoring platform and with one of the largest reaches in the market, the IT-INSIGHT monitor allows the review of components in the network in an effective way, concentrating all the information obtained in organized graphic reporting boards that allow to have a quick view for decision making, adjustable thresholds, grouping of infrastructure by production units among other qualities.
The investment in infrastructure represents a vital asset of the company and its business continuity, keeping these applications and services online and available represents every day more effort due to their complexity and growth.
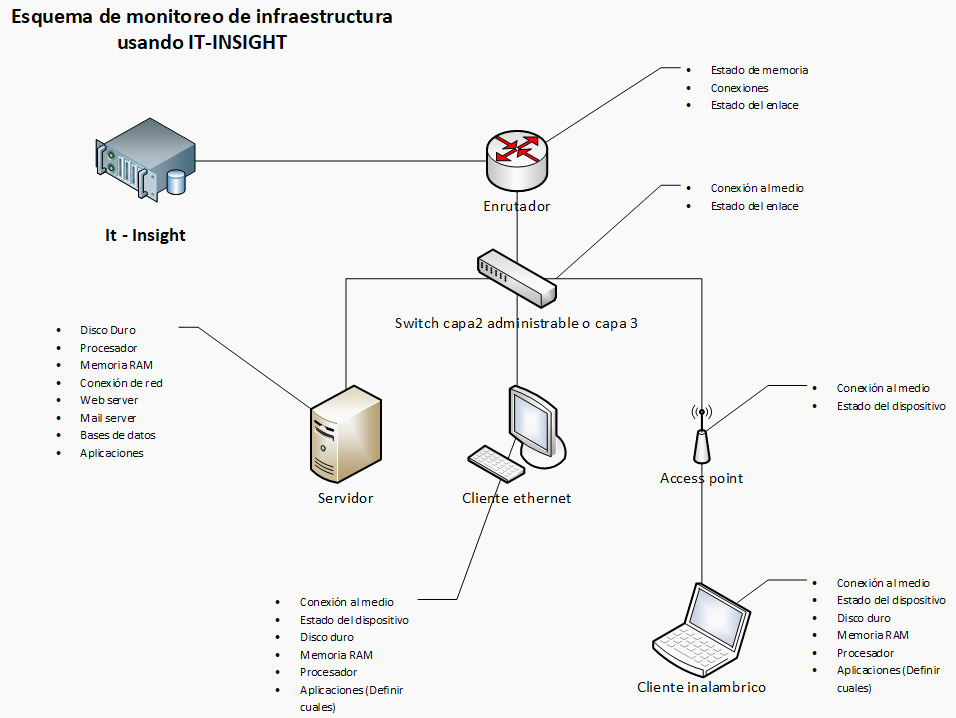
Dynamic virtual environments, legacy applications, online applications under different development platforms, storage solutions and a whole collection of network and infrastructure devices such as routers, switches, access points, and firewalls.
That is why Postech has developed one of the friendliest and most far-reaching monitoring tools on the market, which allows the review of network components in an effective way, concentrating all the information obtained in organized graphic reporting boards that allow have a quick view for decision making, thus managing to organize, map and alert complex infrastructure monitoring environments and allowing to achieve specified compliance levels, alerting when their behavior is not desired.
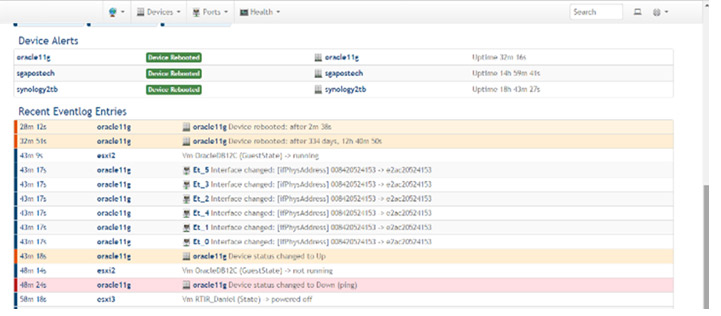
Among its main features are the monitoring of logs through syslog, hardware systems resources (processor load, disk usage, memory, port status ...) and multiplatform support by not having dependency on operating systems when using SNMP protocols.
IT-INSIGHT integrates with help desks and services, since it supports the sending of email messages as alerts that can be linked to detection thresholds and SLAs established by equipment or component.
Benefits
- Increase the productivity of your IT resources.
- Very short implementation times.
- No installation of agents on the computers to be monitored.
- Discovery of devices by network segment via SNMP.
- Sending alerts in real time via SMS, email, and on the control panel.
Characteristics
- Customizable thresholds and alerts, with device bypass capability.
- Comprehensive monitoring.
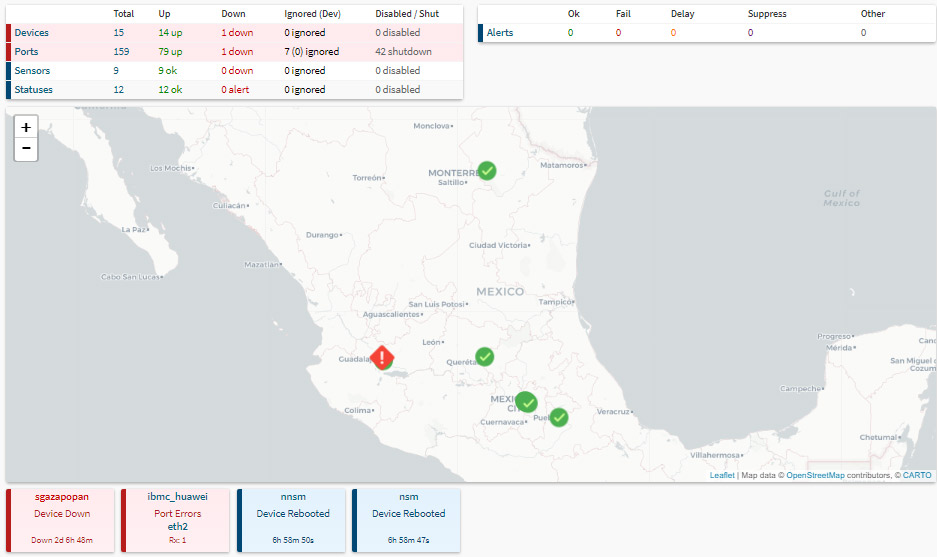
- Centralized visibility.
- Pro activity and planning.
- Real-time and historical reports.
- Ease of use through web interface.
- Access control.
- Real-time incident management.
- Performance of LAN network devices and consumption metrics "Traffic Account".
- Monitoring of services through the correlation of registers (Logs) of applications.
- Monitoring of hardware equipment resources (processor load, disk usage, RAM memory, etc.) in various operating systems.
- Visualization of the status of the network in real time through the web interface, with the possibility of generating reports and graphs of the behavior of the systems being monitored.
- Registry of the list of notifications sent.
- History of problems.
- History of log files.

Among the reports included are TOP 20 devices most alerted in detail, latest devices with problems, last 24 hours of reports among some, as well as reports by date range, component type, associated group, etc.